Topic: Films - Bài mẫu IELTS Speaking Part 1
1900.com.vn tổng hợp và giới thiệu bài viết Topic: Films - Bài mẫu IELTS Speaking Part 1 giúp bạn ôn luyện và đạt kết quả cao trong bài thi Tiếng Anh.

Cách viết Pie Chart IELTS Writing Task 1 từ A - Z giúp đạt điểm cao
Pie Chart là dạng biểu đồ được dùng để so sánh cho các đối tượng với mức độ tổng thể. Điểm đặc biệt ở dạng biểu đồ này chính là mỗi phần thường sẽ được biểu diễn bằng số liệu (thường là dưới dạng phần trăm) cho một đối tượng cụ thể nào đó, tên các đối tượng được biểu diễn với màu sắc hoặc ký hiệu của chúng ở bên cạnh. Chúng ta có thể chia dạng biểu đồ này ra làm 2 dạng đó là:
Ví dụ của dạng bài Pie Chart: "The pie charts compare ways of accessing the news in Canada and Australia. Summarise the information by selecting and reporting the main features, and make comparisons where relevant".
Phần tiếp theo, chúng ta hãy cùng tìm hiểu cách viết dạng bài Pie Chart “chuẩn chỉnh” từ A-Z qua một số cách cụ thể dưới đây để giúp bạn luyện thi IELTS hiệu quả tại nhà nhé:
Trong phần đầu tiên - phần Introduction Pie Chart, hãy vận dụng đầy đủ những kiến thức về paraphase khi triển khai bài viết một cách hiệu quả. Khi giới thiệu, cách làm Pie chart trong phần introduction, hãy sử dụng các cấu trúc sau đây:
Ví dụ: The charts below show the comparison of different kinds of energy production in Dutch in five years.
| Subject | Verb | WHAT | WHERE | WHEN | |
| Đề bài | The charts below | show | the comparison of different kinds of energy production | in Dutch | In five years |
| Paraphrase thành Introduction | The pie charts | illustrate | the proportion of energy produced by different sources | in Dutch | in 1995 and 2000 |
➡ Introduction: The pie charts illustrate the proportion of energy produced by different sources in Dutch in 1995 and 2000.
Tương tự như những dạng biểu đồ theo xu hướng khác, phần Overview trong cách viết Wriitng Task 1 Pie Chart sẽ thường được viết theo 2 đặc điểm tổng quan về xu hướng và về độ lớn. Vẫn xét đề bài phía trên, ta có cách viết Overview cho Pie Chart như sau:
➡ Phần Overview: It is clear that the proportion of energy generated by petrol decreased, while the figures for the rest of energy sources had an opposite trend.
The charts below show the comparison of different kinds of energy production in Dutch in five years:
Với dạng bài Pie Chart Writing Task 1, chúng ta có thể chia 2 body theo 2 cách sau đây:
3.1. Chia Details theo năm trong Pie Chart
Detail 1: so sánh các đối tượng vào năm 1995 (lần lượt nhắc đến số liệu từ lớn đến bé. Lưu ý: nếu có đối tượng là “other” thì kể cả khi số liệu lớn hay nhỏ cũng nên nhắc đến sau cùng):
Coal-fired energy accounted for the highest proportion of total energy production in France in 1995, at 29.80 percent. Gas and Petro had slightly lower percentages, at 29.63 percent and 29.27 percent, respectively. Meanwhile, nuclear power generated only 6.40 percent of total energy, with other sources accounting for nearly 5 percent of total energy.
Detail 2: so sánh các xu hướng cho các đối tượng đến năm 2000:
The percentage of energy derived from coal increased slightly in 2000, but it remained the highest figure in the graph, at 30.93 percent. The figure for Gas increased gradually to 30.31 percent, while the figure for Petrol dropped by nearly 10%. The figures for Nuclear and Other sources increased dramatically to 10.10 percent and 9.10 percent, respectively.
3.2. Chia Details theo đối tượng trong Pie Chart
Detail 1: So sánh 2 nhóm Coal và Gas (2 nhóm có số liệu lớn nhất,đều cùng tăng):
Coal energy accounted for the highest proportion of total energy production in France in 1995, accounting for 29.80 percent of total energy production, and this figure increased by about 1% to 30.9 percent in 2000. Similarly, Gas generated 29.63 percent of energy in the first year, rising to 30.1 percent five years later.
Detail 2: Các nhóm còn lại (others):
In terms of the remaining energy sources, the proportion of energy produced from nuclear power and other sources increased by about 5%, to just over 10% and 9%, respectively. Petrol, on the other hand, saw its share drop from 29.27 percent in 1995 to around a fifth in 2000.
Hai chủ đề từ vựng Pie Chart bạn cần thuộc lòng để ôn luyện thi hiệu quả tại nhà cũng như làm thật tốt bài thi IELTS Writing Task 1 nếu gặp phải biểu đồ Pie Chart trong đề thi thực chiến, đó là:
Từ vựng miêu tả số liệu bằng phân số
| Tỉ lệ phần trăm | Phân số | Ví dụ |
| 80% | four-fifths | The number of students in 2022 will increase four-fifths compared to the number of students 4 years ago |
| 75% | three-quarters | We expect a spike in about three-quarters of the rate of population growth |
| 70% | seven in ten | The number of people who died in the famine in 1945 was seven in ten people at that time |
Từ vựng miêu tả bố cục biểu đồ
| Từ vựng Pie Chart miêu tả biểu đồ | Ngữ nghĩa | Ví dụ |
| Account for/take up/ make up /consist of /include /comprise/ contribute/ /constitute + number or percentage | X chiếm (đóng góp) bao nhiêu % | The number of smartphone users in 2022 accounts for about 56% of the total number of people nationwide |
| Account for a bigger (or smaller) share/ Make up a bigger (or smaller) proportion | Có nhiều hơn hoặc ít hơn thị phần/số lượng so với cái khác. | This emotion of surprise accounts for a bigger share than other emotions with 24.9% |
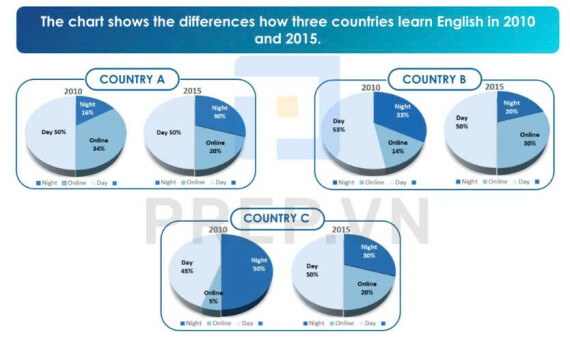
The chart shows the differences how three countries learn English in 2010 and 2015.

The pie charts depict English language learning patterns in three countries between 2010 and 2015. In both years, daytime learners dominated in all countries, with the exception of country A, where there was a shift from studying at night to online learning.
It is clear that in 2010, half of the people polled preferred daytime English classes, which remained constant five years later. In 2010, 34 percent of students preferred online learning, followed by a quarter of students (16%) who preferred night classes. While the former has significantly decreased to 20%, the latter has more than doubled to 30% in 2015. Within five years, the proportion of day and night leamers in country 8 decreased from 53 percent to 50 percent and 33 percent to 20 percent, respectively. Online learning, on the other hand, experienced a surge in popularity during this time, with figures doubling from 14% to 30%.
In Country C, the shift to online learning was the most noticeable, with a fourfold increase from 5% in 2010 to 20% in 2015, compared to a minor increase in daytime learners from 45 to 50% and a significant drop in night learners from 50% to 30%.
Xem thêm các tài liệu Tiếng Anh hay, chi tiết khác:
TOP Việc làm "HOT" dành cho sinh viên:
Đăng nhập để có thể bình luận