Dạng bài Bar Chart trong IELTS Writing Task 1 | Tổng hợp từ vựng, bài mẫu và cách làm (2025)
1900.com.vn tổng hợp và giới thiệu bài viết Dạng bài Bar Chart trong IELTS Writing Task 1 | Tổng hợp từ vựng, bài mẫu và cách làm giúp bạn ôn luyện và đạt điểm cao trong bài thi Tiếng Anh.
Dạng bài Bar Chart trong IELTS Writing Task 1
Tổng hợp từ vựng, bài mẫu và cách làm
Bar chart là gì?
Bar chart – biểu đồ cột là biểu đồ hình cột dùng để mô tả xu hướng thay đổi của các đối tượng theo thời gian hoặc so sánh các dữ liệu của đối tượng.
Thông thường, một biểu đồ cột sẽ bao gồm 2 trục:
Một trục là yếu tố, đối tượng cần được phân tích.
Trục còn lại là số liệu, thông số theo từng đối tượng tương ứng.
Biểu đồ cột thường được biểu diễn theo cột nằm dọc hoặc nằm ngang, nhưng dù được biểu diễn theo cách nào thì cách viết so sánh, mô tả số liệu vẫn không thay đổi.
Một số lưu ý với dạng biểu đồ cột:
Miêu tả và phân tích số liệu theo cách khách quan nhất. Thí sinh không được đề cập các quan điểm cá nhân hay những thông tin khác không được nhắc đến trong câu hỏi.
So sánh, làm nổi bật những đặc điểm chính (cao nhất, thấp nhất) hoặc xu hướng (tăng hoặc giảm) của đối tượng.
Tránh sa vào liệt kê số liệu khiến cho bài viết của bạn trở nên dài dòng, không đáp ứng được yêu cầu đề bài.
Bố cục rõ ràng theo cấu trúc: Mở bài (Introduction) – Overview (Tổng quan) – Details (Chi tiết). Trong đó, mở bài khoảng 1-2 câu, tổng quan 1 câu và chi tiết được chia thành 2 đoạn.
Ngữ pháp phong phú và ngôn ngữ linh hoạt.
Bài viết Writing Task 1 dạng Bar Chart gồm 3 phần chính như sau:
Introduction (1 câu)
General Overview (2 câu)
Specific Details (mô tả thông tin chi tiết)
Cách làm dạng bài bar chart
Bước 1: Phân tích biểu đồ
Sau khi đọc đề bài, bước vô cùng quan trọng tiếp theo là phân tích biểu đồ. Mỗi đề bài sẽ gồm ba phần:
Phần 1: Mô tả ngắn gọn về biểu đồ “The bar chart below shows…”
Phần 2: Chỉ dẫn bạn đến yêu cầu của bài: “Summarise the information …and make comparisons…”
Phần 3: Một biểu đồ, cụ thể ở dạng bài này là Bar chart.
Để phân tích được biểu đồ, bạn cần làm rõ 4 yếu tố sau:
Topic – Đối tượng mà biểu hướng đến đồ là gì?
Place – số liệu trong biểu đồ được lấy từ đâu?
Time – số liệu trong biểu đồ được lấy tại thời điểm nào?
Unit of measurement – Đơn vị đo của số liệu trong biểu đồ?
Bước 2: Note lại những thông tin quan trọng
Sau khi đã phân tích đề và nắm được các điểm quan trọng trong bài, bạn cần ghi lại thông tin quan trọng từ biểu đồ, bao gồm:
Điểm cao nhất? – Health Services
Điểm thấp nhất? – Air Pollution
Có sự thay đổi vượt trội nào trong biểu đồ không?
Các điểm chung của số liệu là gì?
Bạn có thể dựa vào những thông tin trên để phân tích và so sánh theo đúng với yêu cầu của đề bài. Nắm bắt các thông tin này sẽ giúp bạn hạn chế tình trạng liệt kê khi làm bài Writing Task 1.
Bước 3: Chiến lược viết từng phần của bài mô tả Bar chart
Cách viết phần Introduction
Đối với phần giới thiệu, bạn chỉ cần biểu đạt lại đề bài bằng cách dùng từ đồng nghĩa hoặc thay đổi cấu trúc trong câu.
Cấu trúc viết câu mở bài:
The bar chart + show(s)/illustrate(s)/give(s) information about + 3W (what?, where,
Từ vựng thường dùng: Show – illustrate – give – compare,…
Cách viết phần Overview Task 1 dạng Bar chart
Ở phần tiếp theo này, bạn nên thể hiện các đặc trưng chủ yếu mà bạn có thể thấy trong biểu đồ, chỉ cung cấp các thông tin chung chung và so sánh nếu có.
Một vài lưu ý khi viết overview:
Overview chỉ nên gồm 2 câu, thứ nhất là giới thiệu chung về biểu đồ và hai là những thông tin chính.
Không đưa số liệu vào overview.
Chỉ nên chọn từ 2-3 ý chính để viết.
Một số cụm từ vựng IELTS Writing Task 1 Bar chart dùng cho phần Overview:
As is observed: Theo quan sát
Overall: Nhìn chung
Generally speaking: Nói chung là
At a first glance: Thoạt nhìn
As can be seen: Như có thể thấy
Increase/Rise: tăng lên, Decrease/Fall: Giảm đi, …
Remain stable: Không thay đổi
Hit the peak/ hit the highest point: Đạt điểm cao nhất
Slightly: Không đáng kể
Dramatically: Đáng kể
Gradually: Dần dần
Cách viết phần Body
Phần Body là nơi cho phép bạn trình bày nhiều thông tin chi tiết liên quan đến những dữ liệu bạn có. Đối với phần này, đừng chỉ liệt kê thông tin mà cần chú ý thêm một số câu so sánh vào bài viết để tránh mất điểm đáng tiếc nhé.
Cụ thể, phần body sẽ có cấu trúc như sau:
Phần body thứ nhất: phải có từ 3-4 câu miêu tả chi tiết nhóm thông tin đầu tiên từ biểu đồ hoặc những điểm giống nhau của biểu đồ
Các cụm từ sử dụng trong phần body: accounted for: chiếm, reached a peak of: đạt cực đại là, just over: cao hơn 1 chút, approximately: khoảng, xấp xỉ,…
Cấu trúc thường dùng trong phần body: Fell to + số liệu, Fell by + phần trăm,…
Các dạng bài Bar chart
Dạng 1: Bar Chart có sự thay đổi theo thời gian
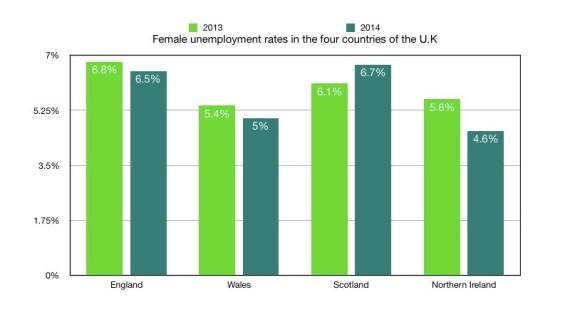
The graph below shows female unemployment rates in each country of the United Kingdom in 2013 and 2014.
Summarise the information by selecting and reporting the main features, and make comparisons where relevant.
1. Introduction
Để viết được một phần mở bài đầy đủ, trước hết chúng ta cần xác định được những thông tin sau trong đề bài:
Topic (Chủ đề của biểu đồ)
Place (Nơi chốn)
Time span (Thời gian)
Unit of measurement (Đơn vị đo)
Ví dụ: The bar chart shows the different modes of transport used to travel to and from work in one European city in 1960, 1980 and 2000
Chủ đề: female unemployment rates
Nơi chốn: each country of the United Kingdom
Khoảng thời gian: năm 2013 và 2014
Đơn vị đo lường: phần trăm (%)
Sau khi đã xác định xong các yếu tố trên, chúng ta sẽ paraphrase lại để bài bằng cách sử dụng từ đồng nghĩa hoặc thay đổi cấu trúc ngữ pháp.
The bar chart illustrates the percentage of jobless women in 4 different countries in Britain in 2013 and 2014
Từ trong đề bài
Từ đồng nghĩa
The graph
The bar chart
shows
illustrates
female unemployment rates
the percentage of jobless women
each country of the united kingdom
4 different countries in britain
2. General Overview
Trong phần Overview, chúng ta nên quan tâm đến những đặc điểm nổi bật bằng cách
So sánh điểm đầu và điểm cuối của các đối tượng được so sánh để phát hiện chúng tăng, giảm hay giữ nguyên
So sánh đối tượng đó với các đối tượng còn lại trong đề bài để xác định được đối tượng nào có số liệu nổi bật và ít nổi bật nhất
Từ hình trên, chúng ta có thể nhận thấy rằng:
Phần trăm phụ nữ thất nghiệp ở England,Wales và Northern Ireland giảm
Phần trăm phụ nữ thất nghiệp ở Scotland tăng
Tỉ lệ thất nghiệp ở nữ giới của England và Scotland cao hơn hai nước còn lại
Từ đó, ta có phần overview như sau:
Looking at the graph, it is readily apparent that England, while Wales and Northern Ireland successfully decreased the unemployment rates among women, the figure for Scotland showed an upward trend. It is also of note that the unemployment rates of English women and Scottish women were remarkably higher than those in Wales and Northern Ireland.
3. Body
Cách tổ chức thông tin
Đoạn body 1 nói về số liệu của năm 2013
Đoạn body 2 nói về số liệu của năm 2014
Bên cạnh đó, cần dùng các từ nối để liên kết các câu và làm nổi bật sự giống nhau hoặc tương phản của số liệu
OUTLINE
BODY 1: Số liệu của năm 2013
Cao nhất: England (6.8%)
Cao thứ hai: Scotland (6.1%)
Hai nước có số liêu gần bằng nhau: Northern Ireland và Wales (5.4% và 5.6%)
BODY 2: Số liệu của năm 2014
Cao nhất: Scotland (Tăng đến 6.7%)
Xu hướng đối nghịch: Wales và Northern Ireland (giảm còn 5.0% và 4.6%)
Xu hướng tương tự: England (cũng giảm còn 6.5%)
Từ outline trên, ta viết thành hai đoạn thân bài như sau:
In 2013, the percentage of unemployed women in England stood at 6.8%, followed by Scotland at 6.1%. Meanwhile, the proportion of women who were out of work in Northern Ireland and Wales was relatively similar, with respective figures being 5.4% and 5.6%.
A year later, the rate of unemployed women in Scotland experienced a slight increase to 6.7%, making it the highest figure in the year 2014. Such a trend was not seen in the figure for their counterparts in Wales and Northern Ireland, which went down to 4.6% and 5.0% respectively. Similarly, England also witnessed an insignificant drop, although to a larger extent, to 6.5% in the unemployment rate.
Sample hoàn chỉnh
The bar chart gives information about the percentage of jobless women in 4 different countries in Britain in 2013 and 2014
Looking at the graph, it is readily apparent that England, while Wales and Northern Ireland successfully decreased the unemployment rates among women, the figure for Scotland showed an upward trend. It is also of note that the unemployment rates of English women and Scottish women were remarkably higher than those in Wales and Northern Ireland.
In 2013, the percentage of unemployed women in England stood at 6.8%, followed by Scotland at 6.1%. Meanwhile, the proportion of women who were out of work in Northern Ireland and Wales was relatively similar, with respective figures being 5.4% and 5.6%.
A year later, the rate of unemployed women in Scotland experienced a slight increase to 6.7%, making it the highest figure in the year 2014. Such a trend was not seen in the figure for their counterparts in Wales and Northern Ireland, which went down to 4.6% and 5.0% respectively. Similarly, England also witnessed an insignificant drop, although to a larger extent, to 6.5% in the unemployment rate.
Dạng 2: Bar Chart không có sự thay đổi theo thời gian
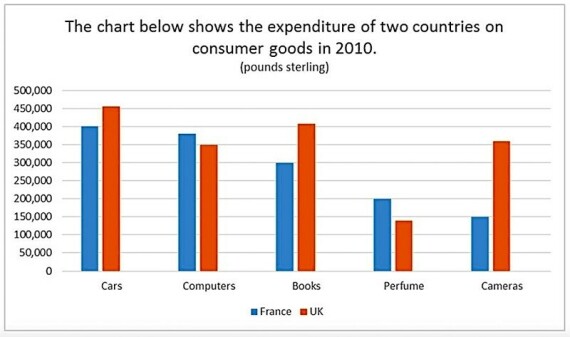
The bar chart below shows the expenditure that people in two different countries spent on consumer goods in 2010.
1. Introduction
Tương tự như dạng bar chart có số liệu thay đổi theo thời gian, ta xác định được
Chủ đề: expenditure of people
Nơi chốn: France and UK
Khoảng thời gian: không có
Đơn vị đo lường: pounds
Sau khi đã xác định xong các yếu tố trên, ta paraphrase đề bài
The bar chart gives information about the spending of people on five categories in two European countries namely France and Britain in 2010
Từ trong đề bài
Từ đồng nghĩa
Shows
Gives information about
The expenditure
The spending of people on five categories
France and UK
in two European countries namely France and Britain
Lưu ý: Trong đề bài có từ “below” (bên dưới), tuy nhiên khi Paraphrase lại, chúng ta cần phải bỏ từ này đi vì khi đi thi, bài viết của chúng ta không có hình đi kèm bên dưới
2. General Overview
Trong phần Overview, chúng ta nên đặt câu hỏi như sau:
Có hạng mục so sánh nào cao hơn/ thấp hơn hẳn so với các hạng mục còn lại không?
Có sự biến đổi số liệu theo thời gian không?
Giữa hai chủ thể được so sánh (quốc gia, nam và nữ, thành phố…), đối tượng nào luôn luôn cao hơn đối tượng còn lại không?
Kết hợp nhìn vào biểu đồ ở trên, ta thấy:
Biểu đồ nay không có sự biến đổi số liệu theo các năm
Nước hoa là mặt hàng ít được chi nhiều tiền nhất trong khi xe hơi được chi tiền nhiều nhất
Người ở Anh chi tiền cho hàng hoá tiêu dùng nhiều hơn người ở Pháp
Từ đó, ta có phần overview như sau:
It is evident that perfume is the kind of commodity that people in Britain and France spent the least amount of money on. In addition to this, the expenditure of British people was higher than that of their French counterparts
3. Body
Với dạng bài không có sự thay đổi theo thời gian, chúng ta có hai cách chia thân bài:
Cách 1: Nhóm các hạng mục so sánh lại với nhau và chia thành hai đoạn văn
Cách 2: Mỗi đoạn thân bài miêu tả số liệu riêng của một chủ thể so sánh (quốc gia, nam và nữ, thành phố…)
Lưu ý: vì đây là dạng bài chỉ có một năm, nên chúng ta không thể diễn tả tăng hay giảm mà chỉ liệt kê và so sánh số liệu.
Ta có OUTLINE theo cách 1 như sau:
OUTLINE
BODY 1: Nhóm các mặt hàng được chi tiêu nhiều (cars, computers và books)
Cars: Anh: 450 000 poundsPháp: 400 000 pounds
Computers Anh: 350 000 poundsPháp: 380 000 pounds
Books Anh: 400 000 poundsPháp: 300 000 pounds
BODY 2: Nhóm các mặt hàng được chi tiêu ít (perfume và cameras)
Perfume Anh: 130 000 poundsPháp: 200 000 pounds
Cameras Anh: 150 000 poundsPháp: 350 000 pounds
Xem thêm: Cách đọc Bảng nhiều dữ liệu trong IELTS Writing task 1 và Cấu trúc bài viết Writing Task 1 như thế nào là chuẩn
Để kết nối các hạng mục so sánh lại với nhau, ta sử dụng các từ “Regarding, With regard to , When it comes to (khi nhắc đến)”.
Từ outline trên, ta viết thành hai đoạn thân bài như sau:
Regarding cars, the amount of money that people in the UK spent on this category stood at 450 000 pounds, which was remarkably higher than that of France, at 400 000 pounds. Similarly, a total of 400 000 pounds was spent on books in Britain while the expenditure on this category was significantly lower in France, at 300 000 pounds
With regard to the cameras, British citizens spent 350 000 pounds on this device, doubling the figure for France, at only 150 000 pounds. Spending on perfume was the lowest category. To be specific, 130 000 pounds was spent on this commodity in the UK , whereas that of France was 200 000 pounds.
Sample hoàn chỉnh
The bar chart gives information about the spending of people on five categories in two European countries namely France and Britain in 2010
It is evident that perfume is the kind of commodity that people in Britain and France spent the least amount of money on. In addition to this, the expenditure of British people was higher than that of their French counterparts
Regarding cars, the amount of money that people in the UK spent on this category stood at 450 000 pounds, which was remarkably higher than that of France, at 400 000 pounds. Similarly, a total of 400 000 pounds was spent on books in Britain while the expenditure on this category was significantly lower in France, at 300 000 pounds
However, in terms of computers, the spending of French consumers exceeded that of the British, with respective figures being 380 000 pounds and 350 000 pounds.
With regard to the cameras, British citizens spent 350 000 pounds on this device, doubling the figure for France, at only 150 000 pounds. Spending on perfume was the lowest category. To be specific, 130 000 pounds was spent on this commodity in the UK, whereas that of France was 200 000 pounds.
Một số từ vựng cho Bar Chart trong IELTS Writing Task 1
1. Từ vựng cho Bar Chart – miêu tả câu mở đầu
Từ vựng/ cụm từ vựng cho Bar Chart
Ý nghĩa
Ví dụ
As is observed, clause
Theo quan sát, mệnh đề
As is observed, The figures for imprisonment in the five countries mentioned show no overall pattern, but rather significant variations from country to country.
Generally speaking,clause
Nói chung, mệnh đề
Generally speaking, Citizens in the United States had a far higher standard of living than citizens in the other countries.
As can be seen,clause
Như có thể thấy, mệnh đề
As can be seen, The peak times for passengers to use the London Underground station were 8:00 a.m. and 6:00 p.m.
At a first glance,clause
Thoạt nhìn, mệnh đề
At a first glance, it is clear that a higher percentage of native university students violated regulations and rules than foreign students.
Overall,clause
Nhìn chung, mệnh đề
Overall, males, regardless of employment status, enjoyed significantly more leisure hours than women.
2. Từ vựng cho Bar Chart – miêu tả sự thay đổi và tốc độ
Từ vựng/ cụm từ vựng cho Bar Chart
Ý nghĩa
Ví dụ
Rise
tăng lên
Inflation is rising exponentially of 3.2 percent per month.
Increase
tăng lên
The House prices have increased dramatically.
Decrease
Giảm đi
Production capacity could decrease by up to 30%, thus bringing down prices.
Fall
Giảm đi
The company’s shares fall 17.5p to 13p.
Remain stable
Không thay đổi
The leisure industry is remaining stable.
Fluctuate
Dao động
The Dow Jones was up 0.88% at 10,204.93 after fluctuating more than 210 points early in the day.
Hit the highest point
Đạt điểm cao nhất
The leisure industry hits the highest point
Dramatically
đáng kể
Lawsuits against big drugs companies have multiplied dramatically in recent years.
Gradual
dần dần
There is increasing pressure on exporters to gradual raise prices in foreign markets.
Slight
không đáng kể
As prices slight escalated, fewer people could afford a mortgage on a house.
3. Từ vựng cho Bar Chart – dùng để liệt kê
Từ vựng/ cụm từ vựng cho Bar Chart
Ý Nghĩa
Ví dụ
Correspondingly
Tương ứng
Sports and racing games accounted for 21% and 17% correspondingly
Respectively
Tương ứng
The proportions of females aged 20-25 and 40 or older giving birth remained relatively stable at around 35% and 10%, respectively.
4. Từ vựng cho Bar Chart – giới từ thường sử dụng
Từ vựng/ cụm từ vựng cho Bar Chart:
Nghĩa
Ví dụ
between …and
Giữa, và
The bar graph below shows the consumption of fish and different kinds of meat in a European country between 1979 and 2004
From… to
từ … đến
Inflation is rising exponentially from 12 dollars to 23 dollars per month.
Fell to + số liệu
Giảm đến số liệu
Inflation fell exponentially to 23 dollars per month.
Fell by + phần trăm
Giảm đến bao nhiêu phần trăm
Inflation fell exponentially by 20% per month.
Bài mẫu về Bar chart trong Writing Task 1
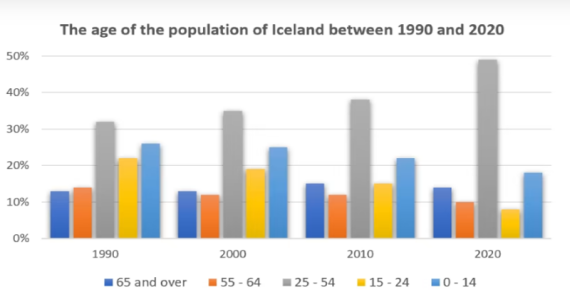
Bài 1: The graph gives information about the age of the population of Iceland between 1990 and 2020.
Summarize the information by selecting and reporting the main features, and make comparisons where relevant.
The bar chart compares the different ages of people living in Iceland between 1990 and 2020.
All in all, the size of the 25-54 age group increased the most over the period while the size of the two younger age groups decreased a little bit. The number of people in the two older age groups stayed about the same.
The 25-54 age group grew from approximately a third of the population in 1990 to nearly half of the population in 2020.
The older two age groups did not increase or decrease much. The size of the 65 and over age group remained at about 13%, whereas the size of the 55 -64 age group only fell from about 14% to about 10% of the population.
By contrast, the 0-14 age group fell from just over 25% in 1990 to just under 20% in 2020. Similarly, the 15-24 age group dropped from just over 20% of the population in 1990 to just under 10% of the population in 2020.
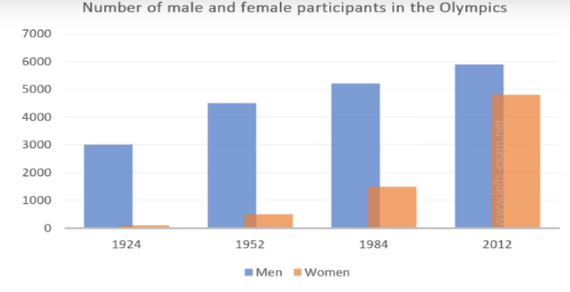
Bài 2: The chart and graph below give information about participants who have entered the Olympics since it began.
Summarize the information by selecting and reporting the main features, and make comparisons where relevant.
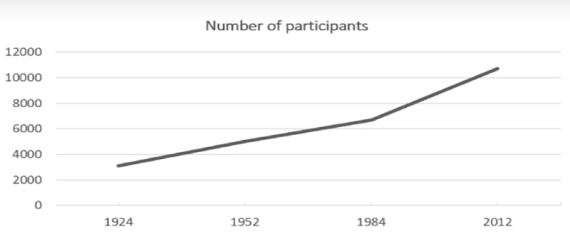
The two charts give information about the gender and number of athletes who have entered the Games since they started. The bar chart illustrates the number of men and women entering the Games, whereas the line graph shows the number of participants.
It is evident from the bar chart that, until 2012, there were always significantly more men entering the Games than women. In 1924 and 1952, there were hardly any women entering the Games, yet in 1952 there were over 4,000 male participants. In 2012, however, the number of female athletes rose significantly to nearly 5,000, only approximately 1,000 lower than male participants.
The line graph shows a similar trend, with the number of participants increasing throughout the century. The most significant increase occurred between 1984 and 2012 when the number of athletes rose from just over 6,000 to over 10,000 in 2012.
To summarize, therefore, since 1924 the number of athletes entering the Olympic Games has increased dramatically. This is particularly the case for women, who are now represented in nearly the same numbers as male participants.
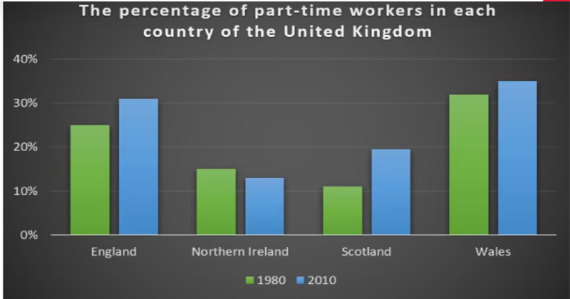
Bài 3: The graph below shows the percentage of part-time workers in each country of the United Kingdom in 1980 and 2010.
Summarize the information by selecting and reporting the main features, and make comparisons where relevant.
The given bar graph shows the rate of part-time employees in four different parts of the UK from 1980 to 2010.
Overall, except for the workers of Northern Ireland, all the people of other countries have shown a rise in the rate of their work as time continues. Also, Wales and England have the most active part-time workers in both eras.
The graph clearly depicts that in 1980, nearly 25% of people worked in England as part-time workers but manpower in whales is about 8% higher than that in England. After 30 years, England shows a greater rise in the rate of workers than that in Whales. But the overall percentage of employees in 2010 still seems to be higher in Wales.
Furthermore, Scotland has the lowest rate of part-time workers with just about 11% while Northern Ireland exceeds more than that in the starting year. As time passes by, the percentage of workers decreases in Northern Ireland in contrast increases twice as that in 1980 in Scotland.
Xem thêm các tài liệu Tiếng Anh hay, chi tiết khác:
Nếu bạn đang tìm cách nâng trình tiếng Anh thú vị hơn thay vì học theo cách truyền thống, việc học qua phim ảnh và video có thể là lựa chọn lý tưởng. Cùng 1900.com.vn khám phá Top 13 website học tiếng Anh qua phim ảnh & video online chất lượng hiện nay — giúp bạn vừa giải trí vừa tiến bộ, nâng cao khả năng nghe nói và phản xạ tự nhiên hơn.
1900.com.vn tổng hợp bài viết về Câu điều kiện loại 1 (First Conditional) đầy đủ các kiến thức bao gồm: Định nghĩa, cấu trúc ngữ pháp, cách dùng, các ví dụ minh họa và bài tập vận dụng. Từ đó giúp bạn nắm vững kiến thức và học tốt Tiếng Anh hơn.
1900.com.vn tổng hợp bài viết về Speaking Forecast 2023 | Bộ đề dự đoán chi tiết mới nhất cung cấp cho người học một loạt các chủ đề, câu hỏi và phương pháp luyện tập để giúp họ nâng cao khả năng giao tiếp tiếng Anh của mình. Từ đó giúp bạn nắm vững kiến thức và học tốt Tiếng Anh hơn.


Bình luận (0)
Đăng nhập để có thể bình luận
Chưa có bình luận nào. Bạn hãy là người đầu tiên cho tôi biết ý kiến!