Line Graph | Đề bài, bài mẫu IELTS Writing Task 1
Bài mẫu IELTS Writing Task 1 Line graph – Bài số 01
1. Đề bài
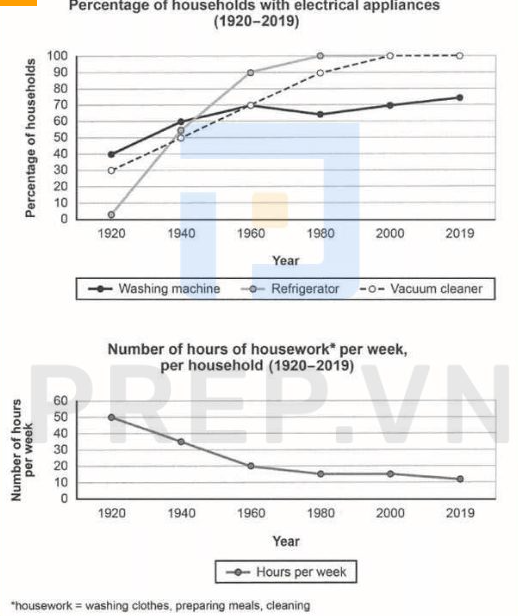
The charts below show the changes in ownership of electrical appliances and amount of time spent doing housework in households in one country between 1920 and 2019.
2. Bài mẫu IELTS Writing Task 1 Line Graph: Electrical Appliances
Between 1920 and 2019, the line graphs show how household ownership of various electrical appliances and time spent per week doing housework in the country changed. According to the first graph, the proportion of households that own these devices has increased over time, with every family owning both refrigerators and cleaners by 2019. The most significant change – vacuum overall was observed between 1920 and 1960; whereas the proportion of households with fridges increased markedly from nearly none to 90%, the proportion of households with washers and vacuums increased more- modestly, both reaching 70%. Following that, ownership of refrigerators reached 100 percent in 1980, and ownership of 1960 washing machines followed in 2000. Following that, ownership of 1960 washing machines was acquired. Vacuum cleaner ownership fell to around 65 percent in 1980 before recovering and reaching a high of 75 percent in 2019.
Bài mẫu IELTS Writing Task 1 Line Graph – Bài số 02
1. Đề bài
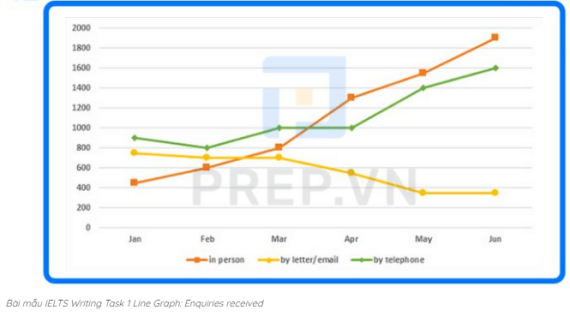
The graph below shows the number of enquiries received by the Tourist Information Office in one city over a six-month period in 2011. Summarize the information by selecting and reporting the main features and making comparisons where relevant.
2. Bài mẫu IELTS Writing Task 1 Line Graph: Enquiries received
During the first six months of 2011, the line graph compares the number of questions received by one particular Tourist Information Office via three different channels: telephone, letter/email, and direct communication. Overall, the office received significantly more inquiries via phone and directly from tourists, as opposed to a gradually declining preference for mailing platforms over the time period provided.
Tourists called the office with about 900 questions, which was the highest number in January. This figure then fell by 100 in February and March before rising to 1000 in March and April, followed by a sharp increase to around 1600 inquiries in June. Similarly, the number of in-person inquiries increased the most, from 450 to 1900, making face-to-face communication the most common method of obtaining travel information.
The trend in written inquiries was the polar opposite. After remaining relatively stable at around 700 questions for the first three months, the number dropped to just 350 questions in May and June.
Bài mẫu IELTS Writing Task 1 Line Graph – Bài số 03
1. Đề bài
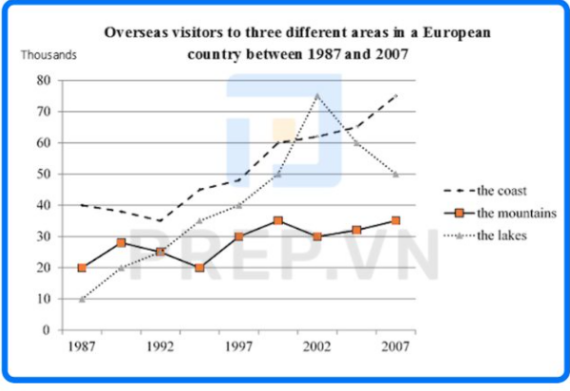
The graph below shows the number of overseas visitors to three different areas in a European country between 1987 and 2007. Summarise the information by selecting and reporting the main features, and make comparisons where relevant.
2. Bài mẫu IELTS Writing Task 1 Line graph: Overseas visitors
From 1987 to 2007, the line graph compares the number of foreign visitors to three different types of natural landscapes in a specific European country over a 20-year period.
While foreign visitors to the coast and mountains increased significantly, the number of tourists to the lakes increased less dramatically, with wild fluctuations over time. Except for the year 2002, the coast was always the most popular destination for visitors.
The coast attracted a total of 40 thousand visitors in 1987. By 1992, the figure had dropped to around 35 thousand, before rising to around 75 thousand in 2007.
Starting at only ten thousand (participle), the number of visitors to the lakes soared to 75 thousand in 2002, when the lakes surpassed the coast in popularity, before plummeting by 25 thousand the following year.
The number of people living in ‘the mountains’ fluctuated wildly before stabilizing at around 35 thousand in 2007. In 1992, both the mountains and the lakes attracted an equal number of foreign visitors.
Bài mẫu IELTS Writing Task 1 Line Graph – Bài số 04
1. Đề bài
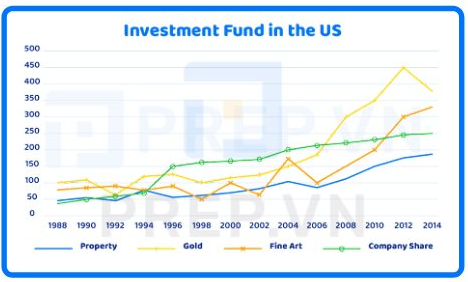
The graph shows the value in US dollars (in millions of dollars) of investment in funds of four categories from 1988 to 2014.
2. Bài mẫu IELTS Writing Task 1 Line graph: Investment fund the US
Between 1988 and 2014, the line graph depicts the amount of money invested in four financial assets: property, gold, fine art, and company shares. Millions of dollars are used to measure units.
All four types of investment funds clearly increased during the time period shown. Gold was the most dramatically increased among them. In 1988, about $50 million was invested in real estate and company stock, while $75 million was spent on fine art and $100 million was spent on gold. The value of a fine art investment fluctuated over the next 18 years. In contrast, property investment increased slightly (about 100 million dollars), while company shares and gold attracted significant investment interest, with both figures exceeding 200 million dollars.
Gold was the most heavily invested asset from 2006 to 2014, reaching a high of 450 million dollars before falling, followed by fine art, which steadily increased from 100 to around 325 million dollars. In comparison, the value of a company’s stock and property has only increased by about $50 million since 2006.
Bài mẫu IELTS Writing Task 1 Line Graph – Bài số 05
1. Đề bài
The chart below shows the average cost of the monthly contracts for four different mobile (cell) phones in a European country from January to September 2022, measured in euros.
2. Bài mẫu IELTS Writing Task 1 Line graph: Cost
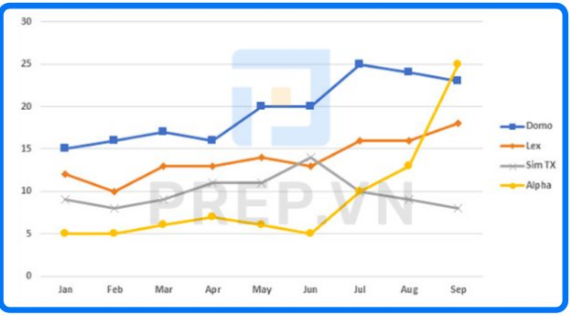
Between January and September 2002, the line graph depicts changes in monthly payment plans for four different European mobile phone brands. While the average monthly cost of Domo, Lex, and Alpha increased to varying degrees over time, with the most dramatic change occurring in Alpha company, the figure for Sim TX remained relatively stable. It is clear that those who used Domo phones had to pay the highest monthly fee.
Customers who used Domo had erratic mobile costs ranging from €15 to €25, with the highest point occurring in July. After paying a manageable €5 on average for mobile services in the first six months, Alpha phone users were hit with skyrocketing costs in the last four months, reaching over €25 in September, a fivefold increase from June. The cost of mobile contracts for both Sim TX and Lex was comparable from January to June, with an overall upward trend reaching the same figure of around 14 euros in June. After that, Lex’s price steadily increased to €17, while Sim TX’s price dropped to only €9 in September.
Bài mẫu IELTS Writing Task 1 Line Graph – Bài số 06
Topic: The line graph shows the number of people who used different communication services in the world.
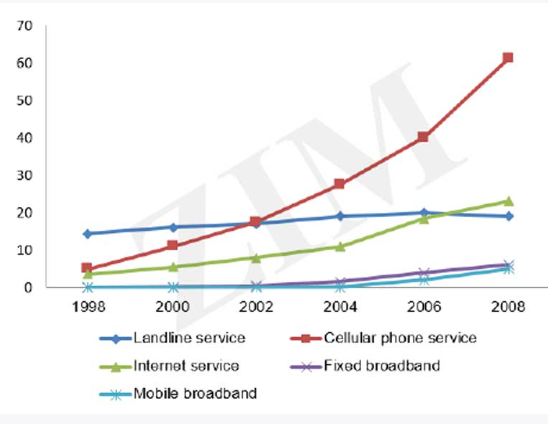
The line graph gives data about the number of users of five different communication services worldwide from 1998 to 2008.
Overall, all services experienced some growth over the 10 year period, with cell phone and Internet services experiencing the most growth and becoming the most popular forms of communication.
In 1998, the figures for cell phone and Internet users started at around 5% of the population. They both increased over the remaining years, with cell phone service gaining the highest position in 2008, with more than 60% percent of the population using this type of service. This number was approximately three times as much as that of Internet service in the same year.
Meanwhile, throughout the 10-year period, little change was seen in the use of landline services, at about 15% of the population. Also, the use of mobile and fixed broadband services was minimal before 2002. The figures for these two services rose slightly to roughly 5% of the population by the last year.
Bài mẫu IELTS Writing Task 1 Line Graph – Bài số 07
Topic: Australian trades with China, Japan and the US
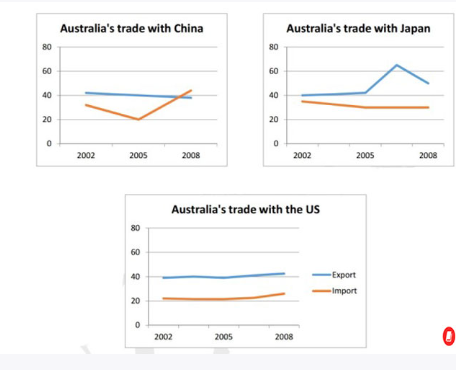
The line graphs show data on Australian trades with three other countries, namely China, Japan and the US.
The initial impression from the graphs is that Australia appeared to earn the highest revenue from exports to Japan. Additionally, Australian-American import-export values remained relatively static over the given period.
Regarding trades between Australia and China, exports underwent a gradual decrease from approximately 43% in 2002 to 40% in 2008. The figure for imports from China stood at about 30% and showed an upward trend to a high of around 43%, despite having an unexpected dip of about 3% in 2005.
Australia’s exports to Japan, after remaining stable for the first three years, soared to its peak of over AU$60 million in 2005, after which this figure halved to about AU$30 million in 2008. Meanwhile, imports from Japan remained consistent at a value of approximately AU$37 million throughout the period.
Trades between Australia and the US appeared to be the most stable, with both import and export values stabilized at around 23% and 40% respectively.
Bài mẫu IELTS Writing Task 1 Line Graph – Bài số 08
Topic: The chart below shows the unemployment rate and the number of people leaving Ireland from 1988 to 2008. Summarize the information by selecting and reporting the main features and make comparisons where relevant.
Dàn bài
1. Introduction: Paraphrase đề bài.
- The chart below → the graph/chart (bỏ “below”).
- shows → presents.
- the unemployment rate → the proportion of unemployed citizens.
- and → as well as.
- the number of people leaving Ireland → the population migrating from Ireland
- from 1988 to 2008 → between 1988 and 2008.
2. Overview: Nhận xét những đặc điểm nổi bật (3–4 ý, bao gồm những xu hướng chính, và những điểm khác biệt).
- Tỷ lệ thất nghiệp ở Ireland đã giảm đáng kể.
- Số người rời khỏi nước này lại dao động.
- Trong mười sáu năm đầu tiên, cả hai đều có xu hướng chung là đi xuống chung.
- Sau năm 2004, hai mô hình đã trở nên khác biệt rõ rệt.
3. Details: Làm rõ những ý ở phần Overview bằng cách mô tả sự thay đổi qua các giai đoạn và dẫn số liệu cụ thể.
- Paragraph 1: Tỷ lệ thất nghiệp.
- Paragraph 2: Số người di cư ra nước ngoài.
Sample answer 7.5+
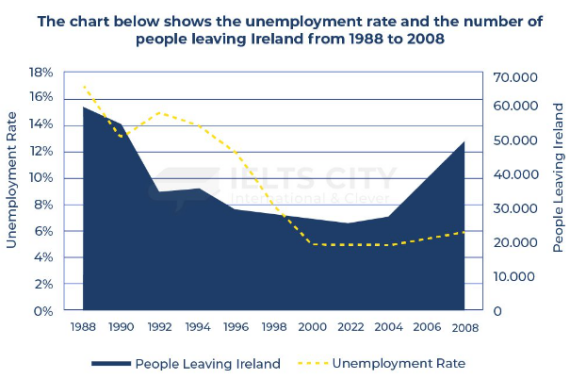
The graph presents the proportion of unemployed citizens as well as the population migrating from Ireland between 1988 and 2008.
Overall, the unemployment rate in Ireland dropped substantially, while the number of people leaving the country fluctuated. However, during the first sixteen years, both showed general downward trends. It was after 2004 that their patterns clearly differed.
The percentage of the Irish population who were jobless decreased quite continually, starting with a fall from 17% to 13% over the first year and another drop of 8% between 1992 and 2000, with the only exception of a marginal increase of 2% from 1990 to 1992. After 2000, the figure remained relatively stable at around 6%.
In 1988, approximately 60,000 people left Ireland, but this figure declined, like the percentage of unemployed people, almost by half until 1992. After this point, the decline slowed down (from 35,000 to 30,000) for four years and leveled off around 30,000. However, 2004–2008 saw a significant rise in emigration from below 30,000 to 50,000 people, whereas the unemployment rate stabilized during these years.
Từ vựng highlight
1. Unemployed [adj]: without a job although able to work (thất nghiệp).
2. Migrate [v]: to move from one town, country, etc. to go and live and/or work in another (di cư).
3. Fluctuate [v]: to change frequently in size, amount, quality, etc., especially from one extreme to another (dao động).
4. Differ [v]: to be different from somebody/something (khác).
5. Jobless [adj]: without a job (thất nghiệp).
6. Marginal [adj]: small and not important (không đáng kể).
7. Level off/out [phr. v.]: to stay at a steady level of development or progress after a period of sharp rises or falls (chững lại).
8. See something [v]: to be the time when an event happens (chứng kiến). Ví dụ: 2004–2008 saw a significant rise in emigration. (Giai đoạn 2004–2008 chứng kiến sự gia tăng đáng kể của tình trạng di cư).
9. Emigration [n]: the act of leaving your own country to go and live permanently in another country (sự di cư).
10. Stabilize [v]: to become or to make something become steady and unlikely to change; to make something stable (ổn định).
Bản dịch
Biểu đồ thể hiện tỷ lệ công dân thất nghiệp cũng như dân số di cư khỏi Ireland từ năm 1988 đến năm 2008.
Nhìn chung, tỷ lệ thất nghiệp ở Ireland đã giảm đáng kể, trong khi số người rời khỏi đất nước này lại dao động. Tuy nhiên, trong mười sáu năm đầu tiên, cả hai đều có xu hướng chung là đi xuống. Sau năm 2004, hai mô hình đã trở nên khác biệt rõ rệt.
Tỷ lệ dân số Ireland thất nghiệp giảm khá liên tục, bắt đầu giảm từ 17% xuống 13% trong năm đầu tiên và giảm thêm 8% từ năm 1992 đến năm 2000, với ngoại lệ duy nhất là mức tăng nhẹ 2% từ 1990 đến 1992. Sau năm 2000, con số này tương đối ổn định ở mức khoảng 6%.
Năm 1988, khoảng 60.000 người rời Ireland, nhưng con số này đã giảm, giống như tỷ lệ người thất nghiệp, gần một nửa cho đến năm 1992. Sau thời điểm này, sự suy giảm chậm lại (từ 35.000 xuống 30.000) trong bốn năm và chững lại ở khoảng 30.000. Tuy nhiên, giai đoạn 2004–2008 chứng kiến sự gia tăng đáng kể lượng người di cư từ dưới 30.000 lên 50.000 người, trong khi tỷ lệ thất nghiệp ổn định trong những năm này.
Xem thêm các tài liệu Tiếng Anh hay, chi tiết khác:
TOP Việc làm "HOT" dành cho sinh viên:


Bình luận (0)
Đăng nhập để có thể bình luận
Chưa có bình luận nào. Bạn hãy là người đầu tiên cho tôi biết ý kiến!