Topic: Pie chart | Bài mẫu IELTS Writing Task 1
Bài mẫu IELTS Writing Task 1 dạng Pie chart
Đề bài
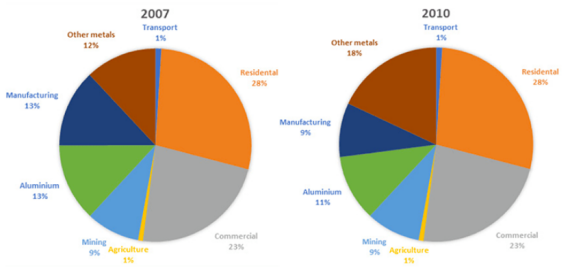
The charts below show the percentage of electricity consumed by different sectors in Eastern Australia in 2007 and 2010.
 Dàn ý
Dàn ý
Mở bài:
1900 sẽ paraphrase lại đề bài để giới thiệu lại đề bài cho người chấm, sau đó viết phần Overview để miêu tả các chi tiết quan trọng, nổi bật nhất trong biểu đồ.
Thân bài
Intro: Overview
While the share of most industries’ power usage stayed the same, there was a change in manufacturing, aluminum and the production of other metals
Body paragraph 1: In 2007
From top to bottom
- The residential sector was the largest sector, at more than a quarter of all energy use
- Commercial sector ranked second at 23%
- Manufacturing and aluminum mining sector at 13% each
- Transport and agriculture - 1% each
Body paragraph 2:
By 2010
Most sectors’ energy usage remained unchanged
- The residential, commercial, agricultural, transport and mining sectors
Sectors witnessed changes
- The aluminum industry’s energy usage dropped from 13% to 11%
- The manufacturing industry’s energy usage also fell from 13 to 9%
- The share of other forms of metal mining rose from 12 to 18%
Bài mẫu 1
The charts give information on the percentage of power used by various sectors in Eastern Australia in 2007 and 2010. Most evidently, we can see that while the share of most industries’ power usage stayed the same, there was a change remanufacturing, aluminum and the production of other metals.
In 2007, the residential sector took up more than a quarter of all energy use, being the largest single energy consuming industry. This is followed by the commercial sector at 23%, and the manufacturing and aluminum mining sector at 13% each. Transport and agriculture both used a measly 1% each, while mining took up 9%.
By 2010, most sectors’ energy usage remained unchanged as a percentage of the total. Indeed, the residential, commercial, agricultural, transport and mining sectors remained at their same proportional consumption, the aluminum industry’s energy usage dropped from 13% to 11%, while the manufacturing industry’s energy usage also fell from 13 to 9% of the total. Conversely, the share of other forms of metal mining rose from 12 to 18%.
Từ vựng
- Various sectors: (noun). Các lĩnh vực khác nhau
- The share: (noun). Phần chia
- Stay the same: (verb). Không thay đổi
- Aluminium: (noun). Nhôm
- Manufacturing: (noun). Ngành sản xuất
- Take up more than a quarter of all energy use: (verb). Chiếm hơn một phần tư tổng lượng năng lượng sử dụng
- To be followed by something: (verb). Được theo sau bởi cái gì đó
- Remain unchanged: (verb). Vẫn không thay đổi
- Drop from 13% to 11%: (verb). Giảm từ 13% xuống 11%
- Fall from 13 to 9%: (verb). Giảm từ 13% xuống 9%
- Rise from 12 to 18%: (verb).Tăng từ 12 lên 18%
Bài mẫu 2
The pie chart illustrates electricity consumption by 8 categories namely residential, commercial, agriculture, mining, aluminum, manufacturing, other metals and transport in Eastern Australia between 2007 and 2010.
Overall, the distribution of electricity remained unchanged except for Aluminium, Other metals, and Manufacturing over the period. In addition, residential and commercial consumption consumed the highest percentage in both years.
In 2007, agriculture and transport both accounted for 1% each in 2007, whereas mining consumed 9% of the total electricity produced. While the residential areas consumed 28% of total electricity, 23% of electricity was consumed for commercial purposes. There were unchanged figures for these sectors in 3 years.
Turning to other remaining categories, the manufacturing and aluminum sectors both consumed 13% in 2007, after which fell down 9% and 11%, respectively. The percentage of other metals dominated at 12% in 2007, compared to that in 2010, with 18%.
Bài mẫu 3
The pie charts illustrate electricity consumption by various fields in Eastern Australia in two year 2007 and 2010.
It is clear that the consumption of electricity from those sectors remained unchanged except for Aluminium, Manufacturing and Other metal fields over the period shown. Additionally, the figures for residential and commercial sectors were by far largest.
In 2007, residential areas consumed 28% of total electricity, while 23% of electricity was consumed for conmmercial purposes. There was 13% of electricity consumed by manufacturing and aluminium sector each, whereas the figures for other metals and mining were slightly lower, at 12% and 9% respectively. By contrast, electricity consumption from transport and agriculture made up only negligible figures.
In 2010, while the percentage of electricity consumed by other metals rose significantly by 6%, those of aluminum and manufacturing fields saw a slight fall to 11% and 9% respectively. Interesting, the proportions of electricity consumed by the other sectors were all as similar as initial figures.
Xem thêm các tài liệu Tiếng Anh hay, chi tiết khác:
TOP Việc làm "HOT" dành cho sinh viên:
Được cập nhật 09/11/2024
43 lượt xem


